It’s important to know how your students interact with your course content as a creator – in order to maximize the value your content provides and identify the type of content, and lessons which your students find the most interesting and spend most of their time on.
While thinkific provides some substantial amount of reporting regarding student engagement but it does not answers questions like how much time Student A spent on a specific Course lesson. I have got several requests from clients who wanted answers of these questions in the form of visual reporting as well as they can export it in the form of excel sheets. So I thought it’s best to create a guide on how to do that.
Its not straightforward and will require you to be a little technical to install my code script to your Thinkific site, I will show you step by step on how to do that but in case if you are not comfortable with code, you can always reach out to me.
Tracking Setup
1. Installing Mixpanel
Alright, so we will be using an external tool for reporting called Mixpanel which will help us track student activity and then visualize it through different reports or export the data in the form of excel sheets. Thinkific already has an integration with Mixpanel which is required as a prerequisite so I suggest you install it to your account and follow this guide by Thinkific to setup the Mixpanel app with Thinkific.
2. Installing Code on Thinkific
Now that you have setup Mixpanel with your Thinkific account, the next step is to install my code into your Thinkific account so it can properly track the student activity inside the Course Player. Just copy the below code and follow the next steps.
<script>
  $(function () {
    if (typeof window.CoursePlayerV2 === "undefined") {
      return;
    }

    let lessonName,
      courseName,
      chapterName,
      startTime,
      endTime,
      sessionDuration,
      percentage;
    let totalDuration = parseInt(sessionStorage.getItem("totalDuration")) || 0;
    function padStartPolyfil(targetLength, padString) {
      targetLength = targetLength >> 0;
      padString = String((typeof padString !== 'undefined' ? padString : ' '));
      if (this.length > targetLength) {
        return String(this);
      }
      else {
        targetLength = targetLength - this.length;
        if (targetLength > padString.length) {
          padString += padString.repeat(targetLength / padString.length);
        }
        return padString.slice(0, targetLength) + String(this);
      }
    };

    function padStartDate(num) {
      return padStartPolyfil.bind(num.toString(), 2, "0")()
    }

    function dateToString(date) {
      if (!(date instanceof Date)) {
        throw new Error("Invalid date object");
      }
      const day = padStartDate(date.getDate());
      const month = padStartDate(date.getMonth() + 1);
      const year = date.getFullYear();
      const hours = padStartDate(date.getHours());
      const minutes = padStartDate(date.getMinutes());
      const seconds = padStartDate(date.getSeconds());
      return `${day}/${month}/${year} ${hours}:${minutes}:${seconds}`;
    }

    function convertToPercent(decimal) {
      const percentage = Math.floor(decimal * 100);
      return `${percentage}%`;
    }

    function formatDuration(duration) {
      const hours = Math.floor(duration / (1000 * 60 * 60));
      const minutes = Math.floor((duration / (1000 * 60)) % 60);
      const seconds = Math.floor((duration / 1000) % 60);
      return `${padStartDate(hours)}:${padStartDate(minutes)}:${padStartDate(seconds)}`;
    }

    CoursePlayerV2.on("hooks:contentDidChange", (data) => {
      lessonName = data.lesson.name;
      courseName = data.course.name;
      chapterName = data.chapter.name;
      percentage = convertToPercent(data.enrollment.percentage_completed);
      startTime = Date.now();
      window.mixpanel.time_event("Session");
      console.log("started at ", dateToString(new Date(startTime)));
      console.log("total duration ", formatDuration(totalDuration));
    });

    CoursePlayerV2.on("hooks:contentWillChange", (data) => {
      endTime = Date.now();
      sessionDuration = endTime - startTime;
      totalDuration += sessionDuration;
      sessionStorage.setItem("totalDuration", totalDuration);
      const percentage = convertToPercent(data.enrollment.percentage_completed);
      const dataToSend = {
        user: Thinkific.current_user,
        "Session Info": {
          "Session Start": dateToString(new Date(startTime)),
          "Session End": dateToString(new Date(endTime)),
          "Course Name": courseName,
          "Chapter Name": chapterName,
          "Lesson Name": lessonName,
          "Session Duration": formatDuration(sessionDuration),
          "Total Time Elapsed": formatDuration(totalDuration),
          "Completion Percentage": percentage,
        },
      };
      window.mixpanel.track("Session", dataToSend);
      console.log("ended at ", dateToString(new Date(endTime)));
      console.log("total duration ", formatDuration(totalDuration));
      console.log("session duration ", formatDuration(sessionDuration));
    });
  });
</script>
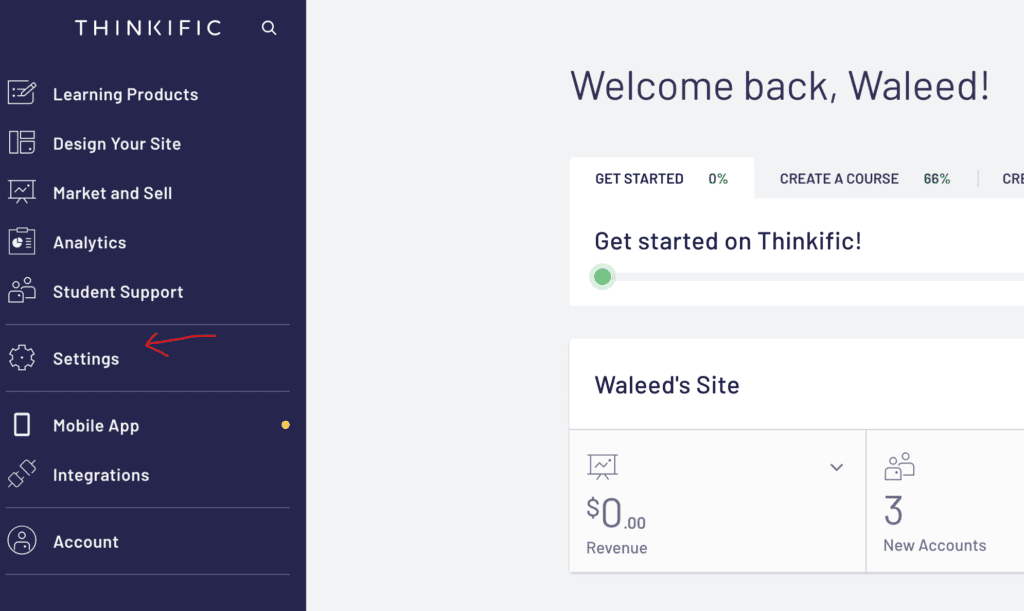
After you copy the code, navigate to your thinkific admin dashboard, then navigate to settings

Click on the ‘Code & Analytics’ panel and then paste the code inside the ‘Site Footer Code’ field and then click save.

Now that you have installed the code inside your Thinkific account, give it some time to gradually collect the data and send it to your connected Mixpanel account. When good amount of data is collected, you will be able to create reports inside Mixpanel and export the data easily.
Reporting Setup
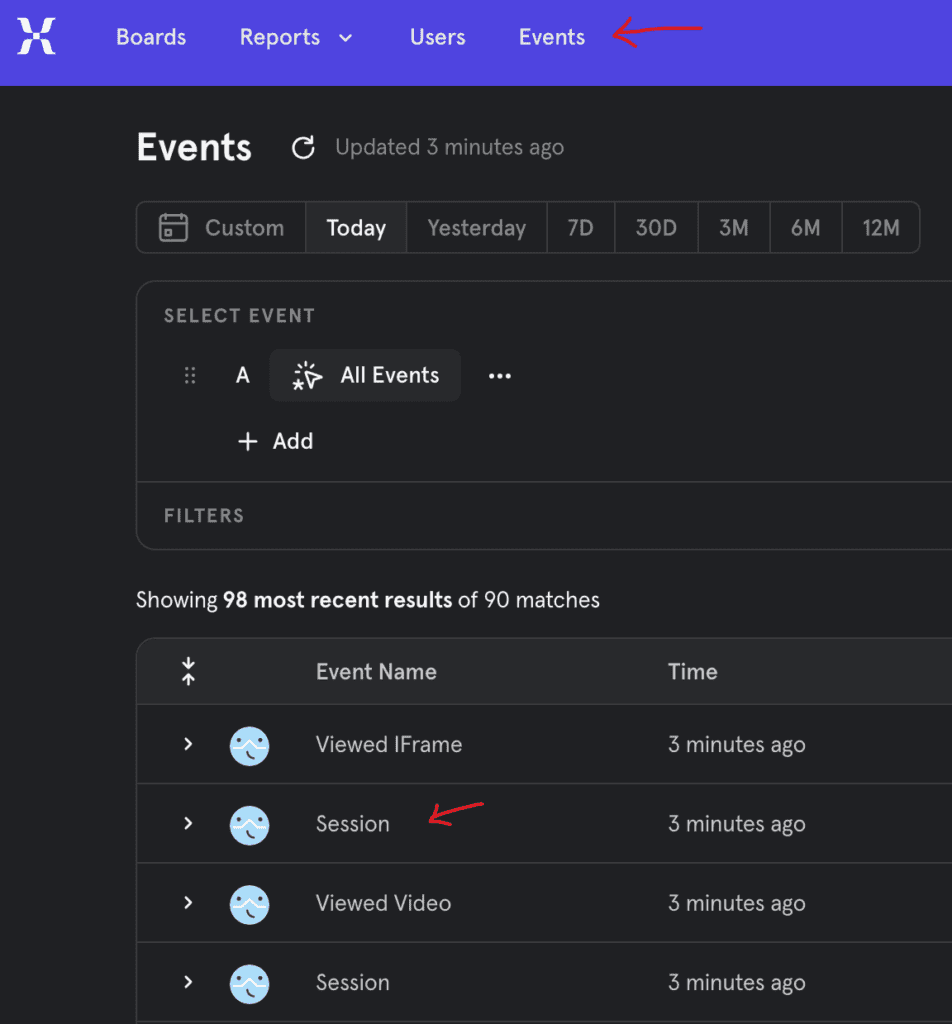
To quickly ensure that data is coming through correctly, do complete some random lesson inside one of your courses – make sure that you don’t have an ad-blocker running on your browser, then navigate to your Mixpanel account then on the top menu open ‘Report’ then you will see live events coming from your Thinkific website in real time.
Look for an event named ‘Session’, if you have it then it means that data is coming through correctly and we can proceed to the reporting part.

Now let’s move to the reporting part, I will just show you how to do basic reporting so you can export the data and do basic visualization. If you want advanced reporting with mixpanel, feel free to reach out to me.
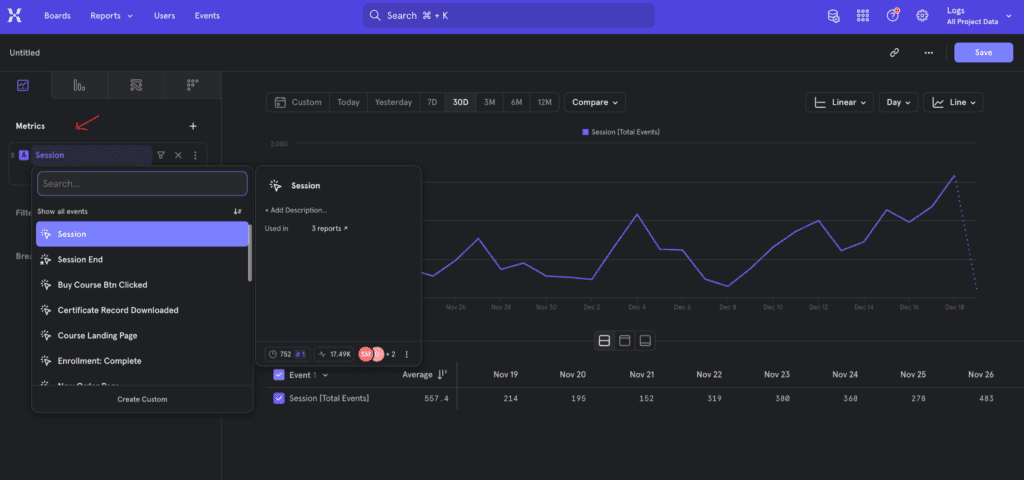
On the top navigation of your Mixpanel dashboard, click on ‘Reports’ dropdown then select ‘Insights’ it will open the report configuration page, from the left hand panel click ‘Select Event’ under ‘Metrics’ and search for ‘Session’.

Now again on the left hand panel you will see two options:
- Filter: This option can be used to create filters based on the different properties that are coming with the event such as user email, course name etc.
- Breakdown: This option is used to add different properties to the reports such as user name, user’s city, email etc.
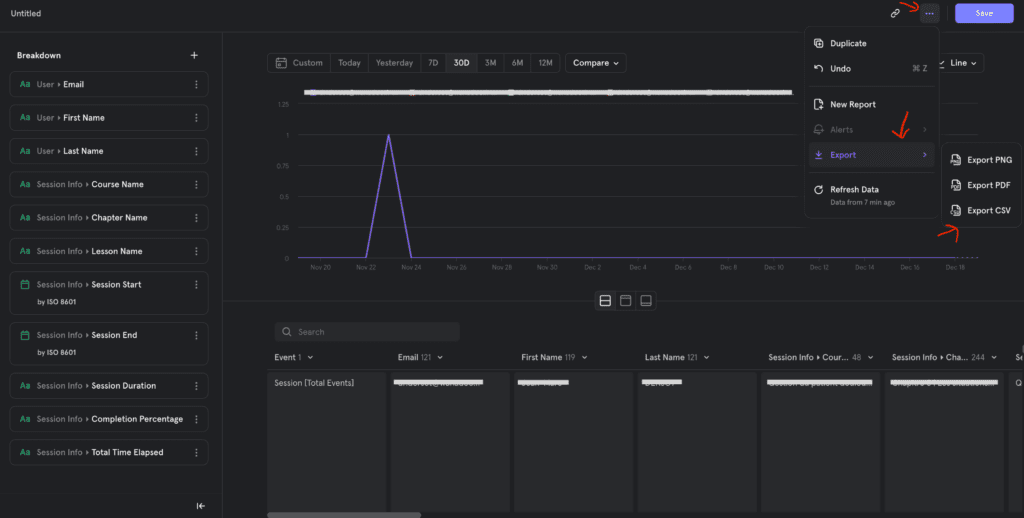
Both of these options are dropdowns, you can click on them and search for any property you want to filter or include in your reports. For student activity we will use the below properties to setup the reports properly.

What is being tracked?
Well we are tracking the student activity inside the Course which tracks when did they start a lesson, when did they end it, how much time they took to complete the lesson (session duration), there completion percentage when they left the course etc.
Now you can play with the report by changing the visualization to a table, changing the time range etc. it’s up to you!
Don’t forget to name and save your reports 😉
Exporting the reports
To export the reports as a csv file see the image below

Final Thoughts
While these metrics should be enough for most of your Student tracking needs but if you need to dig more deeper into the Student activity or setup highly customized reports – reach out to me anytime!
